Univariate I
populations follow parameters
µ
samples follow statistics
x
distribution of statistics can be
symmetrical
or asymmetrical (skewed)

kurtosis: extent to which distribution is "in the tails"
leptokurtic: sharp curve
platykurtic: gradual curve
Modality: number of modes (most frequent score)
Summation Notation
Σx=sum of all x values
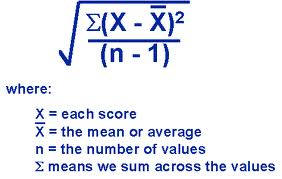
Standard Deviation
sample SD = s
population SD = σ
variance is the square of each respectively
s^2, σ^2
Sample distribution: comprised of raw scores
Sampling distribution: comprised of values of a statistic
Central Limit Theorem:
the mean of a sufficiently large number of
independent
random variables, each with finite mean and variance, will be approximately
normally distributed (Rice
1995)
z scores
t distribution (sampling distribution)
confidence interval around mu
Hypothesis testing
events that occur vs. event that may occur by chance (observations versus
expectations)
control group vs. experimental group
number of heads vs. tails
extent to which can predict X from Y
the null hypothesis reflects a match between observation and expectation based
on chance
Type I and Type II errors
power and its determinants
χ^2 tests
goodness of fit test

Type I error: Ho true but rejected
Type II error: Ho false but failed to reject
Experimental design
participants assigned randomly to conditions
co relational and quasi-experimental research participants' membership in groups
is a subject variable
sources of random error:
pre-existing differences among participants
measurement error
ANOVA
analysis of variance
F ratio
Heuristic F
computational F
Assumptions
normality: populations from which groups are drawn are normally distributed
homogeneity of variance
independent errors
Power determinants in ANOVA
sample size
error variance
alpha
effect size
orthogonal comparisons: allow only as many comparisons as df
between
those comparisons are a priori
those comparisons are independent (i.e. mutually orthogonal)
are the most powerful test subsequent to ANOVA
Bonferroni